Nearly all of the change follows volume.
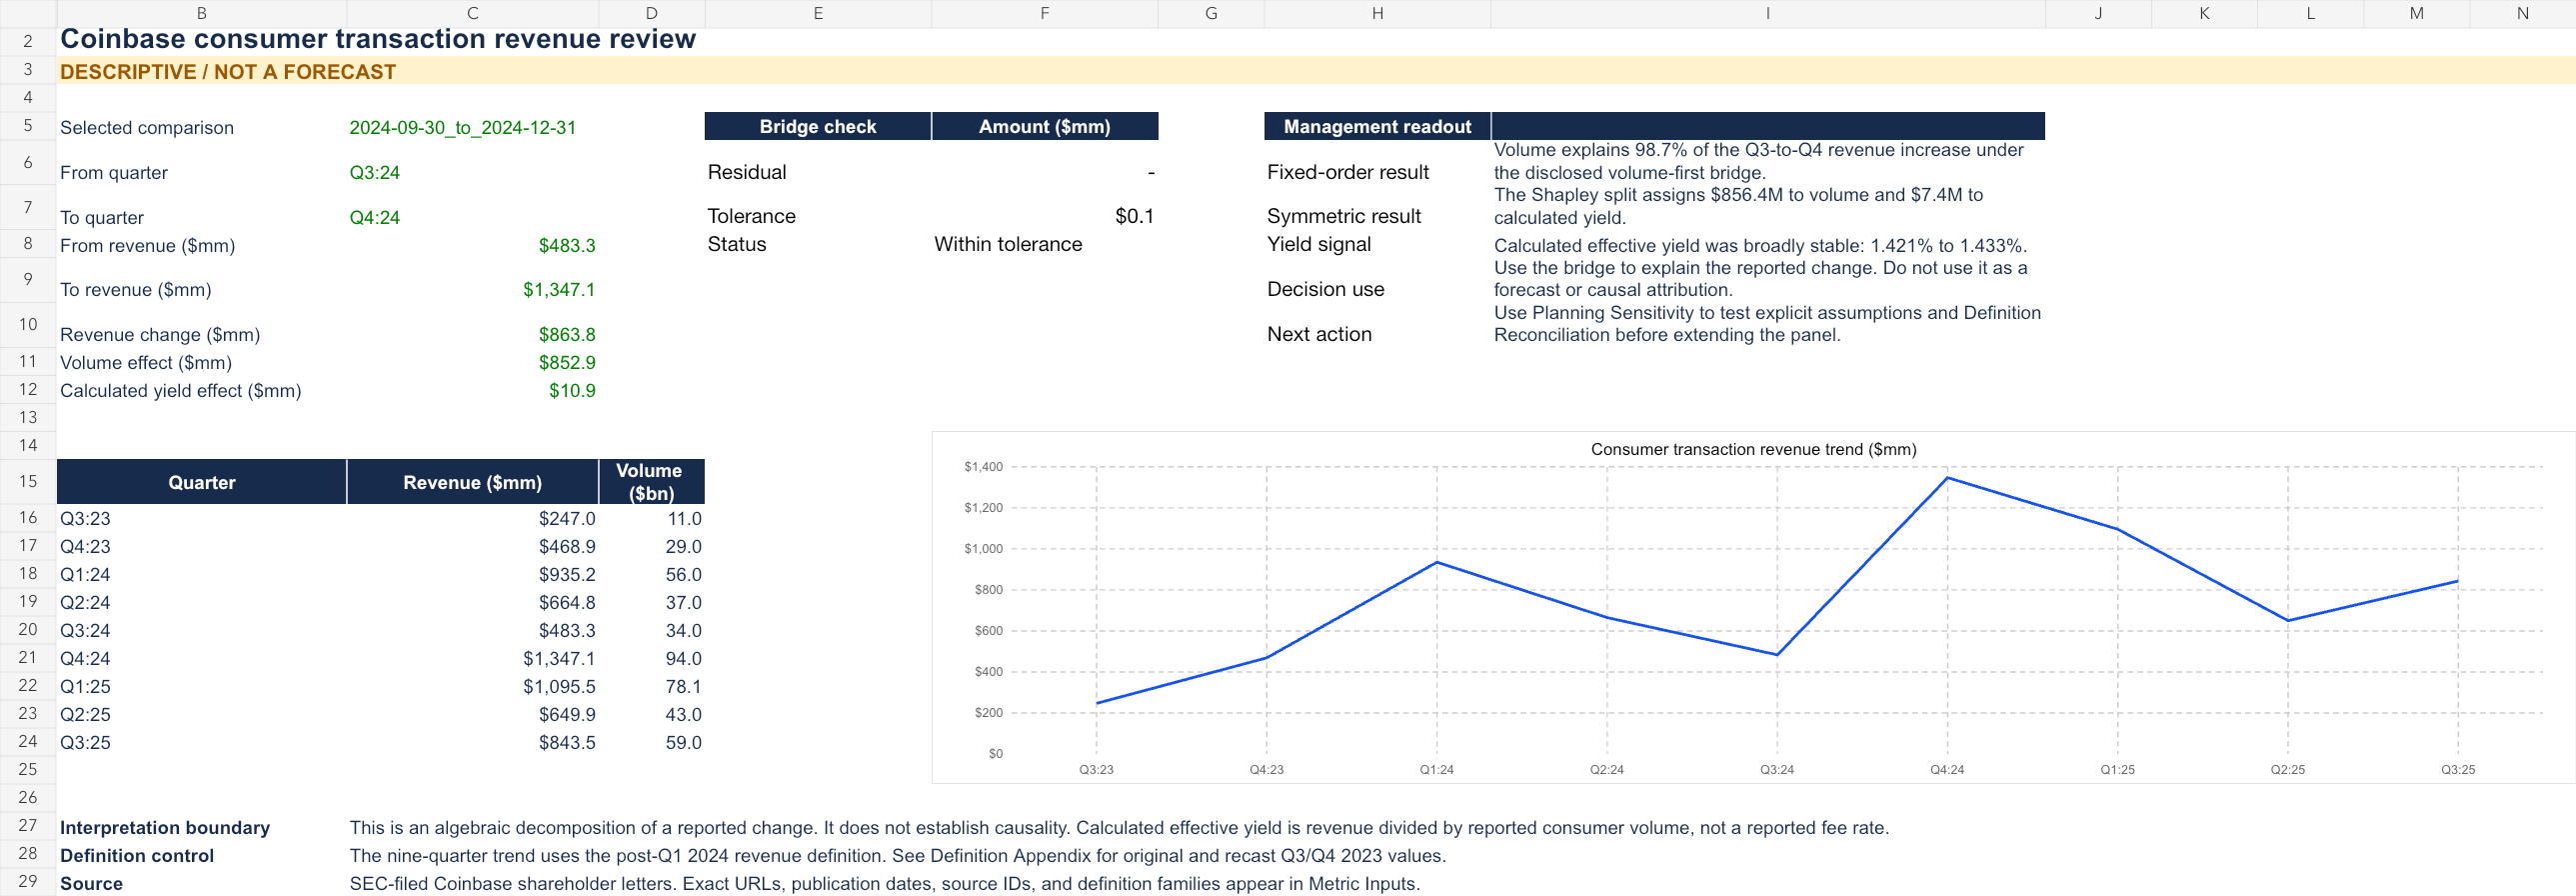
Consumer spot volume increased from $34B to $94B. The fixed-order bridge below reconciles to the reported revenue change.
Three ways to allocate the same change.
The interaction term moves with factor order. The symmetric Shapley method averages the two orders; every method totals $863.8M.
Swipe to view the full table →
Effective yield is consumer revenue divided by consumer spot volume. It is a proxy, not Coinbase’s fee rate. These are accounting decompositions, not causal contributions.
Stress the Q4 2024 reference.
Change volume and effective yield around the reported Q4 result to frame operating questions. The workbook contains editable inputs.
Swipe to view the full table →
| Case | Volume change | Yield change | Implied revenue | Management prompt |
|---|---|---|---|---|
| Downside | −20% | −10 bps | $1,002.5M | Investigate activity retention and mix. |
| Reference | 0% | 0 bps | $1,347.1M | Q4 2024 actual reference; no forecast. |
| Upside | +20% | +10 bps | $1,729.3M | Test operating readiness and mix sustainability. |
Mechanical sensitivities only. These are not Coinbase guidance, probabilities, or expected outcomes.
The newest quarter fell, and volume explains most of it.
Under Coinbase’s newest volume definition, consumer transaction revenue fell from $566.9M in Q1 2026 to $451.7M in Q2 2026 as consumer crypto spot volume fell from $33.8B to $25.8B. The change is −$115.2M.
Swipe to view the full table →
Different volume definition from the Q3 to Q4 2024 bridge above (Q2 2026 earnings deck: excludes stablecoin trading volume, counts routed trades at half), so the two yields are not comparable. Only five quarters exist under it, and Coinbase stopped reporting Trading Volume as a key metric from Q2 2026. Revenue is exact thousands from the 10-Qs. Source: latest-bridge.csv in the repository package. The workbook and PDFs cover the 2024 bridge only.
Comparability determines what the model can say.
A longer time series is useful only when its definitions are consistent.
Definition control
The later Q2 2026 deck restated Q2–Q4 2025 consumer spot volumes below earlier disclosures by $1.5B, $1.6B, and $2.3B. Both vintages are preserved; those periods stay outside the earlier panel.
The source register retains 17 frozen SEC documents with SHA-256 hashes, now including the Q1 and Q2 2026 filings.
Why there is no forecast
A preset gate required twelve comparable quarters: eight to train and four chronological holdouts. Public filings support 9 under one definition (Q3 2023 to Q3 2025), bounded by the Q1 2024 revenue reclassification and later trading-volume changes. Twelve calendar quarters have data through Q2 2026, but they span two incompatible volume definitions and only 5 fall under the newer one, so the gate stays closed at 9 of 12.
This release publishes the bridge and sensitivities without a forecast-accuracy claim.
Built to be checked.
The seven-sheet workbook exposes formulas and source references. The companion package includes the reviewer packet, reproducible SQL, automated definition and cutoff checks, and a public AI contribution disclosure.
Follow the numbers to the source.
Start with the decision memo, inspect formulas, then use the reviewer packet to test the strongest objections.